


Week of November 2, 2026
Published every Monday: Get a detailed snapshot of what moved the markets last week—and what to watch this week.
Resilient U.S. economy accelerates in the third quarter.
Stocks were mixed at the index level last week, but strength was seen beneath the surface. The Russell 2000 was the best-performing part of the market, and the equal-weight S&P 500 also posted a strong week. The Treasury market rallied again, providing ballast to equities as the 10-year yield fell below 5 percent.
Weekly Quick Hits
![]()
Although stocks were mixed amid weakness in AI-related firms, breadth remained strong.

BEYOND THE HEADLINES:
U.S. Economic Growth Picks Up in the Third Quarter
In announcing that it left interest rates unchanged after its October meeting, the Fed upgraded its assessment of the U.S. economy from solid growth to strong growth. The following day, third-quarter GDP data showed accelerating growth, reinforcing the central bank’s more optimistic outlook.
The report was encouraging for investors because it demonstrated that the economy remains resilient despite ongoing headwinds. A strong economy should continue to support earnings growth across corporate America. That strength continues to be reflected in earnings releases, with third-quarter earnings growth expected to exceed 30 percent for the second consecutive quarter.
Strong fundamentals should support markets despite recent volatility among some of the companies most exposed to AI-related spending.
Broad Strength Drives Growth
Third-quarter real GDP came in at 3.4 percent, the fastest pace of growth in a year and up from the 2.4 percent growth rate in the first half of the year. Growth was driven by resilient consumer spending and business investment.
The latter is being driven by the accelerated depreciation allowance in the One Big Beautiful Bill Act and AI infrastructure spending. AI hyperscaler spending is expected to reach $800 billion this year, helping accelerate economic growth.
Even with strong business investment, the U.S. economy continues to be driven by consumers. Consumer spending grew above expectations and approached 4 percent on an annualized basis.
Finally, government spending also contributed to growth in the quarter. All of this bodes well for continued economic growth in the fourth quarter.
Broad Growth Leads to Broad Earnings
Strength across multiple components of GDP should lead to strong revenue across multiple sectors. In turn, this could lead to earnings growth broadening after years of being concentrated among the so-called Magnificent Seven firms. That is exactly what we have seen over the past few weeks.
News has focused on the challenges facing large AI companies and the market’s reaction to their quarterly updates, but the rest of the S&P 500 has fared quite well. Last month, earnings growth expectations for the Magnificent Seven stocks declined after five of them reported results. After the remaining two firms report, analysts expect earnings growth for those seven companies to be 22 percent.
The 493 other companies in the S&P 500, however, have seen earnings expectations rise. Analysts now expect those companies to grow earnings by more than 32 percent. If those numbers hold through the end of reporting season, it would be the first time since the fourth quarter of 2022 that earnings growth for the other 493 companies has exceeded that of the Magnificent Seven, according to FactSet.
Over the long term, investing boils down to finding companies that trade at relatively attractive valuations and have improving fundamentals. As yields on the 10-year Treasury moved higher throughout the summer, investors rewarded fast-growing technology companies. After earnings season began and investors saw the strength in the other 493 companies’ fundamentals, the market broadened. The equal-weight S&P 500 has outperformed the market cap–weighted index for three consecutive weeks after declining during the previous seven.
“Strong fundamentals should support markets despite recent volatility among some of the companies most exposed to AI- related spending.”
Report Releases: October 26–30, 2026
Preliminary Durable Goods Orders:
September (Tuesday)
Headline and core durable goods orders increased in September, which was a good sign for business spending.
- Expected/prior durable goods orders monthly change: +1.9%/+0.1%
- Actual durable goods orders change: +1.8%
- Expected/prior core durable goods orders monthly change: +0.6%/+0.3%
- Actual core durable goods orders change: +0.5%
Conference Board Consumer Confidence Index:
October (Tuesday)
Consumer sentiment improved more than expected last month, which was a welcome rebound after the index slid to its lowest level in more than a decade in September.
- Expected/prior month consumer confidence: 81.0/84.2
- Actual consumer confidence: 91.7
Federal Open Market Committee (FOMC) Rate Decision:
October (Wednesday)
The FOMC left the federal funds rate unchanged after its October meeting, which was widely expected by investors and economists.
- Expected/prior federal funds rate upper limit: 4.00%/4.00%
- Actual federal funds rate upper limit: 4.00%
Advance GDP Annualized:
Third Quarter (Thursday)
Economic growth accelerated in the third quarter. The annualized rate of economic growth rose to 3.4 percent, which also exceeded expectations.
- Expected/prior quarter GDP growth: +3.2%/+2.2%
- Actual GDP growth: +3.4%
Personal Income and Personal Spending:
September (Thursday)
Consumer resilience continued to be evident after another solid month of personal income and spending growth.
- Expected/prior personal income monthly change: +0.3%/+0.3%
- Actual personal income change: +0.2%
- Expected/prior personal spending monthly change: +0.6%/+0.9%
- Actual personal spending change: +0.5%
The Takeaway
- The Fed held rates steady, and economic data exceeded expectations.
- Strength was evident in durable goods, consumer confidence, and personal income and spending.
Financial Market Data
Equity
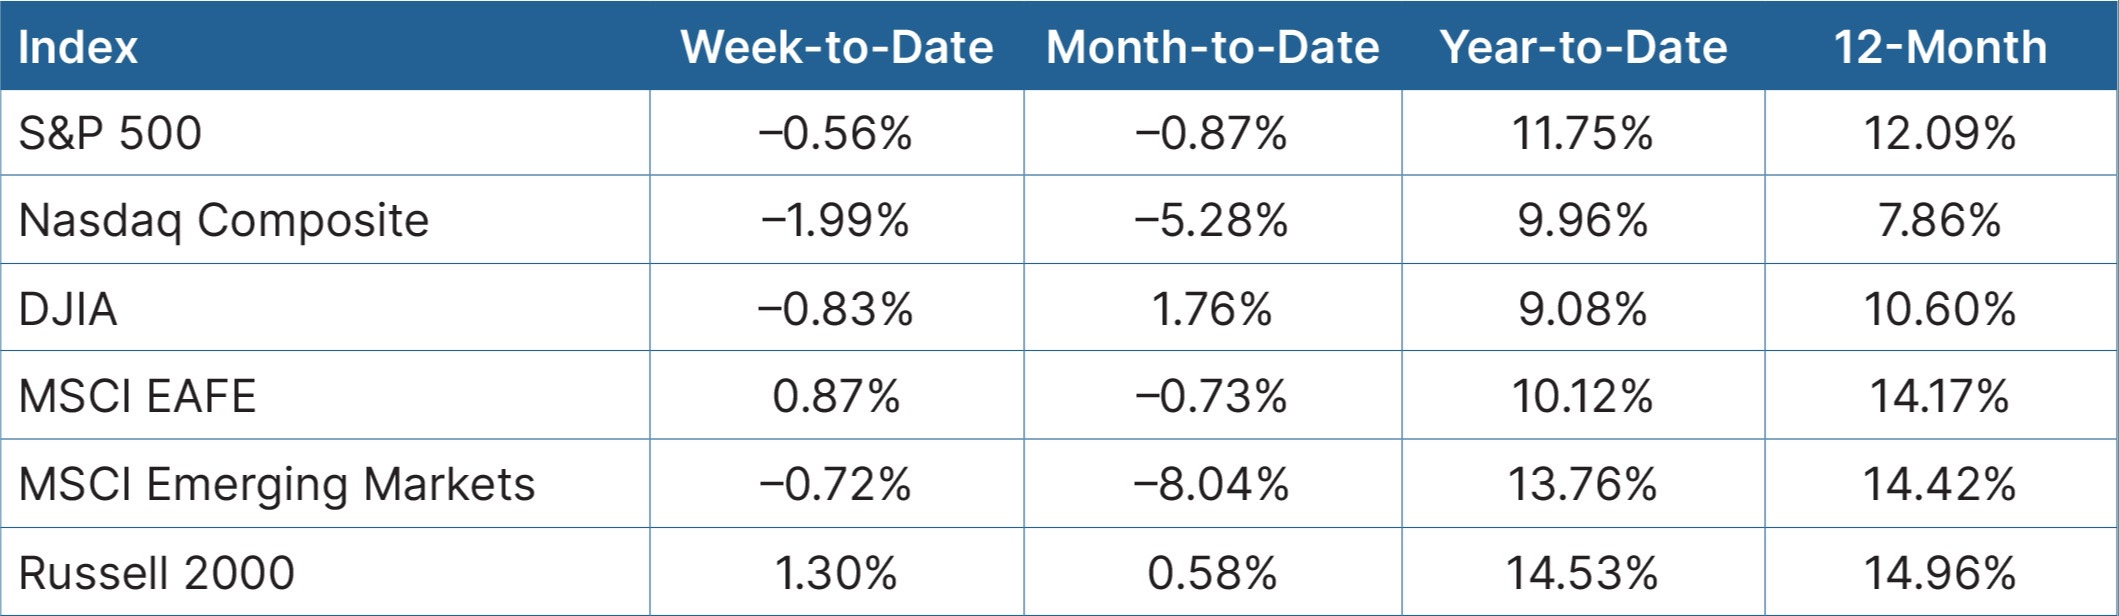
Although equities were mostly lower at the index level, the market displayed continued underlying strength. Sell-offs in the Magnificent Seven and AI-related companies dragged the Nasdaq Composite down 2 percent. The S&P 500 and Dow Jones Industrial Average were modestly lower. The Russell 2000 closed up more than 1 percent, and the equal-weight S&P 500 was up nearly 1 percent. The communication services sector fell more than 8 percent, and technology declined more than 1.5 percent. Health care, materials, and utilities were the strongest-performing sectors. International markets were mixed; developed markets were up almost 1 percent, and emerging markets fell 0.72 percent.
Source: Bloomberg, as of October 30, 2026
Fixed Income
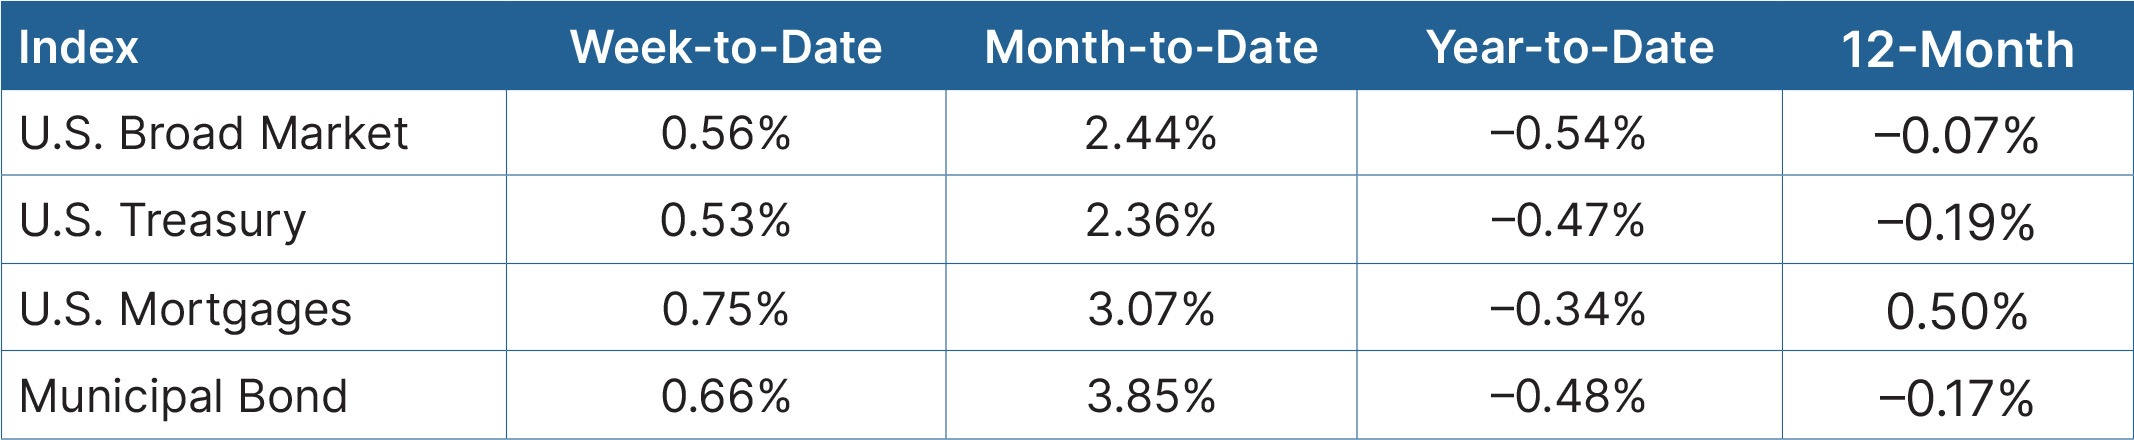
The Treasury market once again rallied across the yield curve on a continued flight to quality amid the ongoing technology sell-off. The 10-year yield declined another 7 basis points (bps), closing at 4.93 percent. Other than the high-yield market, fixed income markets rallied. Core bonds, Treasuries, and mortgages moved up between 0.5 percent and 0.75 percent, and the municipal market rose more than 60 bps.
Source: Bloomberg, as of October 30, 2026
The Takeaway
- Indices were mostly lower, but that masked underlying market strength. The Russell 2000 was the strongest performer.
- A continued flight to quality amid equity volatility helped fixed income markets rally again.
Looking Ahead
The focus this week will be on Friday’s employment report, which will be closely watched to see if hiring bounces back after a weak September.
- The week kicks off on Monday with the Institute for Supply Management (ISM) Manufacturing index for October. Manufacturer confidence is expected to improve modestly.
- On Wednesday, we’ll see the ISM Services index for October. Economists expect service sector confidence to decline slightly for the second consecutive month.
- On Friday, we’ll see the employment report for October and the University of Michigan consumer sentiment survey for November. Economists expect to see 65,000 jobs added, which would be a solid increase after a weak September report. Consumer sentiment is expected to drop again after sliding to a five-month low in October.
- Finally, it’s another big week for earnings releases, with reports expected from Apple, Shopify, McDonald’s, and ConocoPhillips
Disclosure: This material is intended for informational/educational purposes only and should not be construed as investment advice, a solicitation, or a recommendation to buy or sell any security or investment product. Diversification does not assure a profit or protect against loss in declining markets, and diversification cannot guarantee that any objective or goal will be achieved. Please contact your financial professional for more information specific to your situation.
Bonds are subject to availability and market conditions; some have call features that may affect income. Bond prices and yields are inversely related: when the price goes up, the yield goes down, and vice versa. Market risk is a consideration if sold or redeemed prior to maturity.
Certain sections of this commentary contain forward-looking statements that are based on our reasonable expectations, estimates, projections, and assumptions. Forward-looking statements are not guarantees of future performance and involve certain risks and uncertainties, which are difficult to predict. All indices are unmanaged and are not available for direct investment by the public. Past performance is not indicative of future results. The S&P 500 is based on the average performance of the 500 industrial stocks monitored by Standard & Poor’s. The Nasdaq Composite Index measures the performance of all issues listed in the Nasdaq Stock Market, except for rights, warrants, units, and convertible debentures. The Dow Jones Industrial Average is computed by summing the prices of the stocks of 30 large companies and then dividing that total by an adjusted value, one which has been adjusted over the years to account for the effects of stock splits on the prices of the 30 companies. Dividends are reinvested to reflect the actual performance of the underlying securities. The MSCI EAFE Index is a float-adjusted market capitalization index designed to measure developed market equity performance, excluding the U.S. and Canada. The MSCI Emerging Markets Index is a market capitalization-weighted index composed of companies representative of the market structure of 26 emerging market countries in Europe, Latin America, and the Pacific Basin. The Russell 2000® Index measures the performance of the 2,000 smallest companies in the Russell 3000® Index. The Bloomberg US Aggregate Bond Index is an unmanaged market value-weighted performance benchmark for investment-grade fixed-rate debt issues, including government, corporate, asset-backed, and mortgage-backed securities with maturities of at least one year. The U.S. Treasury Index is based on the auctions of U.S. Treasury bills, or on the U.S. Treasury’s daily yield curve. The Bloomberg US Mortgage Backed Securities (MBS) Index is an unmanaged market value-weighted index of 15- and 30-year fixed-rate securities backed by mortgage pools of the Government National Mortgage Association (GNMA), Federal National Mortgage Association (Fannie Mae), and the Federal Home Loan Mortgage Corporation (FHLMC), and balloon mortgages with fixed-rate coupons. The Bloomberg US Municipal Index includes investment-grade, tax-exempt, and fixed-rate bonds with long-term maturities (greater than 2 years) selected from issues larger than $50 million. One basis point is equal to 1/100th of 1 percent, or 0.01 percent.
Authored by the Investment Research team at Commonwealth Financial Network®.
© 2026 Commonwealth Financial Network®
Let’s Talk About Your Financial Future
Whether you’re navigating a volatile market or preparing for the future, we’re here to help.